NYC Outdoor Attribution Case Study
The Marketing Director’s Challenge
Outdoor and transit advertising has always been one of the hardest marketing channels to prove.
You buy the surfaces. You run the campaign. You receive an impression estimate based on foot traffic models. And then the campaign ends.
How do you prove which locations, routes, creatives, or offers actually resulted in new prospects or generated what revenue?
The Indemption Platform is your Answer!
With Indemption, you don't just run a campaign—you indeem 42 surfaces across New York City's transit network, making every single physical asset completely measurable.
- Every surface becomes a project.
- Every project carries its own QR code.
- Every scan enters a Special Landing page we call a Pit Stop.
- Every Pit Stop generates an Identity.
- Every identity becomes a record.
- And every record can be connected to revenue.
This is what it looks like when the physical world finally has attribution.
Surface
QR Code
Pitstop
Identity
Revenue
The Challenge: Without Indemption
Today's marketing managers cobble together a slew of disconnected tools to create and save QR codes, download scan logs, build web forms and landing pages, save data to spreadsheets, run CRM reports, and piece together a PowerPoint summary.
Which route performed best?
Which station converted?
Which neighborhood redeemed?
Which creative won?
Which media buy should be renewed?
Events Everywhere. Evidence Nowhere.
Campaign Architecture: With Indemption
One Campaign.
Organized The Way The Real World Works.
Manhattan Transit OutdoorSpring 2026
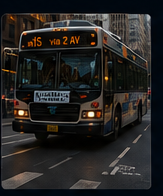
Segment A — Bus Wraps & Cards
- M15 Select Bus — East Side Corridor
- M5 Bus — Riverside to Midtown
- M42 Crosstown — 42nd Street
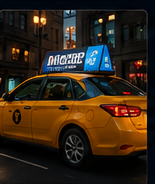
Segment B — Taxi & Rideshare
- Midtown Fleet
- Upper East Fleet
- Downtown Fleet
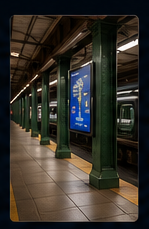
Segment C — Subway
- 4/5/6 Lexington Avenue Platforms
- A/C/E Eighth Avenue Platforms
- L Train — 14th Street Corridor
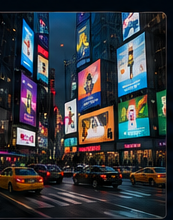
- Times Square Station Domination
- Grand Central Station Domination
Segment D — Bus Shelters & Furniture
- Shelter Network Manhattan
- Digital Kiosks
- Street Furniture & Panels
Segment E — Ground Level & Other
- Billboards
- Posters
- Wayfinding
- Other Surfaces
Every surface becomes a project. Every project becomes measurable.
What We Can Honestly Attribute
Every Scan Knows Where It Came From.
Indemption does not need to guess where a person traveled or infer their phone location. Every QR code belongs to a project. Every project belongs to a surface, route, fleet, station, or segment. When the code is scanned, the scan is tied back to that known campaign structure.
Fixed Locations
- Subway platform
- Bus shelter
- Billboard
- Street furniture
- Station domination
Fixed assets can be tied to known project locations.
Mobile Assets
- Bus route
- Taxi fleet
- Rideshare fleet
- Subway line
Mobile assets are reported by route, fleet, line, or operating corridor.
No modeled locations. No inferred travel paths. Just project-level evidence.
The Story Behind The Data
Not Just What Happened.
Why It Happened.
Times Square
Highest scan volume. Lowest conversion.
5,922 scans2.1% conversion
Grand Central
Lower volume. Highest revenue per scan.
1,219 scans6.8% conversion
M15 Corridor
Strong lunch-hour engagement. Highest wallet save rate.
2,847 scans8.3% wallet save rateThis Is Sarah Chen.

M15 Bus Wrap
QR Scan
Offer Claimed
Email Captured
Wallet Saved
Purchase
Sarah's Record
- Campaign
- Manhattan Transit Outdoor
- Segment
- Bus Wraps & Cards
- Project
- M15 Select Bus
- Route
- East Side Corridor
- Surface
- Bus Side Panel
Revenue Attributed
$84.50
This isn't a scan report. This is a business outcome.
100% Proven. 100% Defensible.What platforms know compared to Indemption
What Other Platforms Know
- A scan occurred
- Maybe the device type
- Maybe the general location
- Maybe the time of day
- A QR code was used
- A landing page was visited
What Indemption Knows
- Which campaign created it
- Which segment generated it
- Which project displayed it
- Which route delivered it
- Which surface drove it
- Which creative produced it
- Which audience engaged
- Which offer converted
- Which purchase resulted
- Which revenue was generated
- Which date and time
- Which touchpoint influenced it
Audience Building
18,901 Strangers Became Leads.
Now Make Them Customers.
Send your scan capture list to any data enhancement service. Append demographics, household income, purchase history, lifestyle data. Build lookalike audiences. Target them digitally. Mail them physically. The anonymous person who scanned your bus ad just became your most valuable prospecting asset.
18,901 Scans Captured
Identity Captured
- Name
- Phone
- Location
- Touchpoint
- Campaign
- Date & Time
Data Enhancement
- Acxiom
- Experian
- Melissa
- LiveRamp
- More
Enriched Audience
- Demographics
- Household Income
- Purchase History
- Lifestyle Interests
- Homeowner Status
- Propensity Scores
Activate & Re-Engage
- Digital Retargeting
- Email Marketing
- Direct Mail
- Lookalike Modeling
- Customer Conversion
All data collected with explicit consent through Pitstop engagement.
Campaign Command Center
One view. Every surface. Every route. Every outcome. One source of truth.
42 Surfaces
8 Routes
112,442 Scans
18,901 Leads
7,822 Wallet Saves
3,981 Purchases
$842,611 Revenue Attributed
The Physical World Has Never Had Attribution. Until Now.
Indemption transforms every bus, train, taxi, shelter, billboard, and physical touchpoint into measurable business intelligence.
Every Surface.Every Route.
Every Outcome.
Proven.